RI NYC Taxi and Limousine Data Walkthrough 🚖
▶️ Try this in Colab! Run the RI NYC Taxi and Limousine Data Walkthrough in Google Colab.
In this walkthrough, we’ll run AI Stress Testing and AI Continuous Testing on public NYC Taxi and Limousine Commission data (https://www.nyc.gov/site/tlc/about/tlc-trip-record-data.page) to demonstrate how RIME can be used with regression models. This data consists of information such as the pickup and dropoff locations, pickup and dropoff times, fare amounts and the number of passengers for every taxi trip that happens in New York City. We’ll be predicting the duration of each trip given a bunch of other information about the trip.
As you might imagine, the COVID-19 pandemic caused a significant change in the number and nature of the taxi rides that occur in New York City. We’ve included data from 2018 to 2021 for this walkthrough to demonstrate how AI Continuous Testing can help you identify and understand such distribution drifts.
To get started, provide the API credentials and link to the backend of RIME to connect the instance.
[ ]:
API_TOKEN = '' # PASTE API_KEY
CLUSTER_URL = '' # PASTE DEDICATED DOMAIN OF RIME SERVICE (e.g., https://rime.example.rbst.io)
AGENT_ID = '' # PASTE AGENT_ID IF USING AN AGENT THAT IS NOT THE DEFAULT
Libraries 📕
Run the cell below to install libraries to receive data, install our SDK, and load analysis libraries.
[ ]:
!pip install rime-sdk &> /dev/null
[ ]:
import pandas as pd
from pathlib import Path
from rime_sdk import Client
Data and Model ☁️
Run the cell below to download and unzip a preprocessed dataset and pretrained model based on public NYC Taxi and Limousine Commission data.
[ ]:
!pip install git+https://github.com/RobustIntelligence/ri-public-examples.git
from ri_public_examples.download_files import download_files
download_files('tabular-2.0/nyc_tlc', 'nyc_tlc')
Next, let’s take a quick look at the reference data (in this case, this was the data used to train the model).
[ ]:
pd.read_csv("nyc_tlc/data/ref.csv", nrows=5)
The key columns to look at above are the TripDuration, the duration of the trip in seconds, and Prediction, our model’s estimate of the duration of the trip. The other columns are features used by the model to help predict the trip duration. We’ll now proceed to run RIME Stress Testing on our data and model! We’ll start by creating a project and uploading our datasets and model.
[ ]:
client = Client(CLUSTER_URL, API_TOKEN)
[ ]:
description = (
    "Run Stress Testing and Continuous Testing on a"
    " tabular regression model and dataset. Demonstration uses the"
    " NYC Taxi and Limousine Commission trip duration dataset"
    " (https://www.nyc.gov/site/tlc/about/tlc-trip-record-data.page)."
)
project = client.create_project(
    'Tabular Regression Demo',
    description,
    "MODEL_TASK_REGRESSION",
)
Uploading Artifacts to Blob Storage
For SaaS environments using the default S3 storage location, the Python SDK supports direct file uploads using upload_*().
For other environments and storage technologies, artifacts must be managed through alternate means.
[ ]:
IS_SAAS = False # TOGGLE True/False (Note: SaaS environments use URLs ending in "rbst.io" and have an "Internal Agent")
[ ]:
if not IS_SAAS:
    BLOB_STORE_URI = "" # PROVIDE BLOB STORE URI (e.g., "s3://acmecorp-rime")
    assert BLOB_STORE_URI != ""

UPLOAD_PATH = "ri_public_examples_nyc_tlc"
[ ]:
if IS_SAAS:
    model_s3_dir = client.upload_directory(
        Path('nyc_tlc/models'), upload_path=UPLOAD_PATH
    )
    model_s3_path = model_s3_dir + "/model.py"

    ref_s3_path = client.upload_file(
        Path('nyc_tlc/data/ref.csv'), upload_path=UPLOAD_PATH
    )
    eval_s3_path = client.upload_file(
        Path('nyc_tlc/data/eval.csv'), upload_path=UPLOAD_PATH
    )

    ref_preds_s3_path = client.upload_file(
        Path("nyc_tlc/data/ref_preds.csv"), upload_path=UPLOAD_PATH
    )
    eval_preds_s3_path = client.upload_file(
        Path("nyc_tlc/data/eval_preds.csv"), upload_path=UPLOAD_PATH
    )
else:
    model_s3_path = f"{BLOB_STORE_URI}/{UPLOAD_PATH}/models/model.py"

    ref_s3_path = f"{BLOB_STORE_URI}/{UPLOAD_PATH}/data/ref.csv"
    eval_s3_path = f"{BLOB_STORE_URI}/{UPLOAD_PATH}/data/eval.csv"

    ref_preds_s3_path = f"{BLOB_STORE_URI}/{UPLOAD_PATH}/data/ref_preds.csv"
    eval_preds_s3_path = f"{BLOB_STORE_URI}/{UPLOAD_PATH}/data/eval_preds.csv"
Once the data and model are uploaded to S3, we can register them to RIME. Once they’re registered, we can refer to these resources using their RIME-generated ID’s.
[ ]:
from datetime import datetime

dt = str(datetime.now())

# Note: models and datasets need to have unique names.
model_id = project.register_model_from_path(f"model_{dt}", model_s3_path, agent_id=AGENT_ID)

ref_dataset_id = project.register_dataset_from_file(
    f"ref_dataset_{dt}",
    ref_s3_path,
    data_params={
        "label_col": "TripDuration",
        "protected_features": ["PULocationID", "TipAmount"]
    },
    agent_id=AGENT_ID
)
eval_dataset_id = project.register_dataset_from_file(
    f"eval_dataset_{dt}",
    eval_s3_path,
    data_params={
        "label_col": "TripDuration",
        "protected_features": ["PULocationID", "TipAmount"]
    },
    agent_id=AGENT_ID
)

project.register_predictions_from_file(
    ref_dataset_id, model_id, ref_preds_s3_path, agent_id=AGENT_ID
)
project.register_predictions_from_file(
    eval_dataset_id, model_id, eval_preds_s3_path, agent_id=AGENT_ID
)
AI Stress Testing
Next, we’ll create a stress testing configuration specifying relevant metadata for our datasets and model and run stress testing! When running stress testing, the reference data should be data used to train the model, and the evaluation data should be data used to evaluate the model. In this case, the reference and evaluation datasets are random splits of the NYC TLC data collected from 2018.
[ ]:
stress_test_config = {
  "run_name": "NYC TLC",
  "data_info": {
    "ref_dataset_id": ref_dataset_id,
    "eval_dataset_id": eval_dataset_id,
  },
  "model_id": model_id,
  "categories": [
      "TEST_CATEGORY_TYPE_ADVERSARIAL",
      "TEST_CATEGORY_TYPE_SUBSET_PERFORMANCE",
      "TEST_CATEGORY_TYPE_TRANSFORMATIONS",
      "TEST_CATEGORY_TYPE_BIAS_AND_FAIRNESS"
  ]
}
stress_test_job = client.start_stress_test(
    stress_test_config,
    project.project_id,
    agent_id=AGENT_ID,
)
stress_test_job.get_status(verbose=True, wait_until_finish=True)
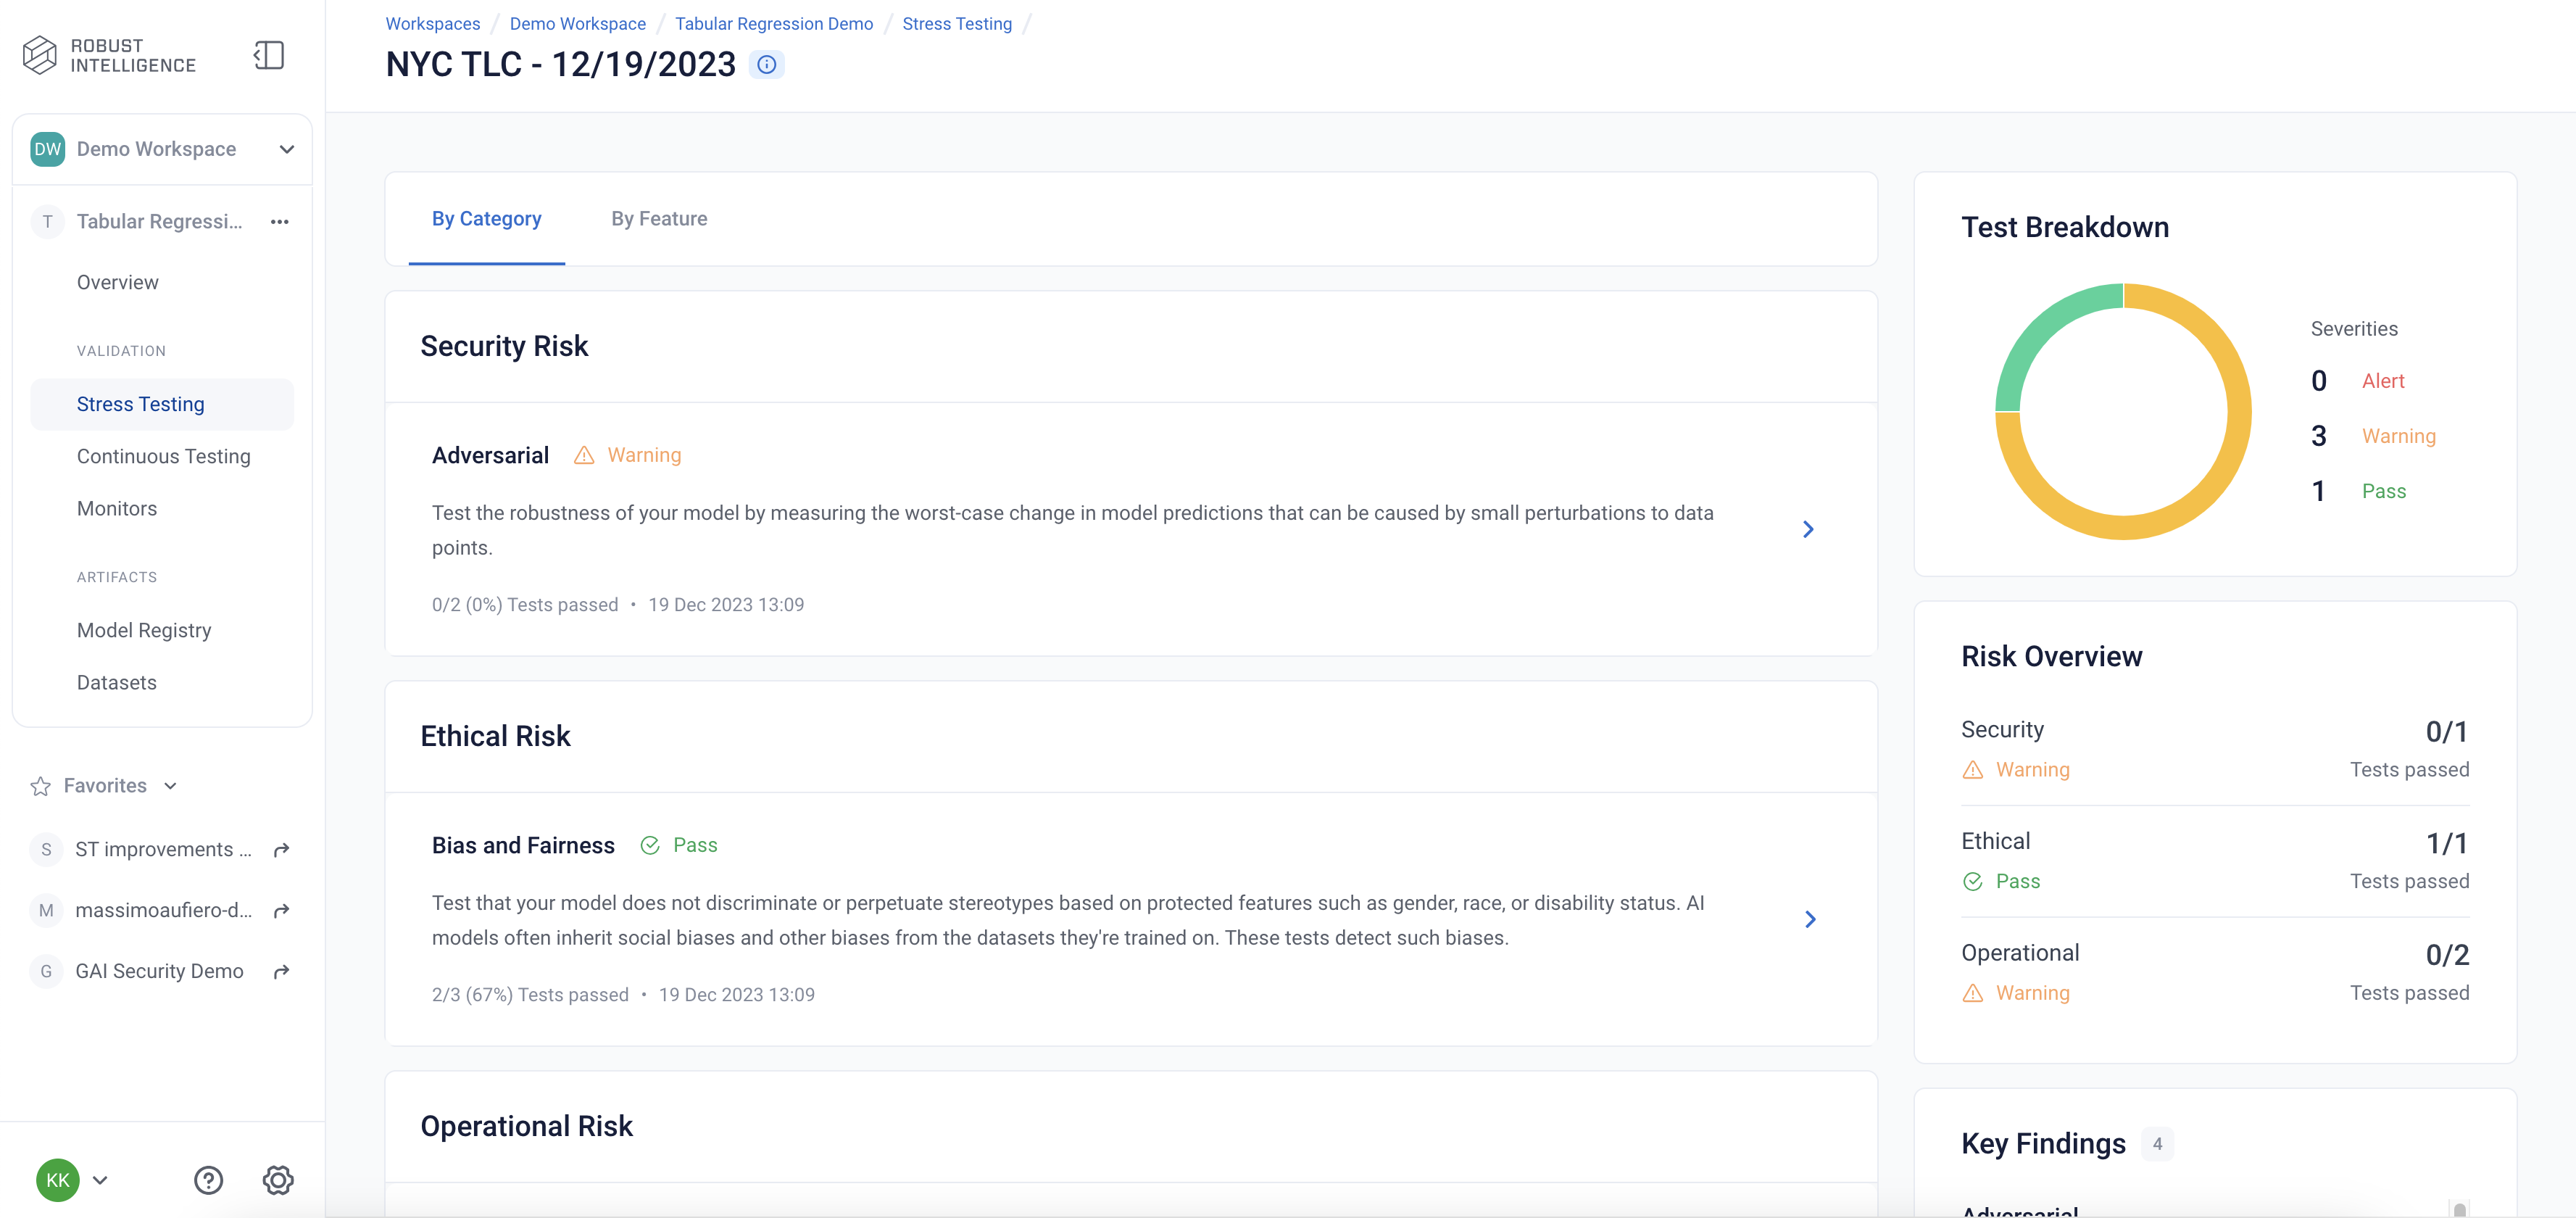
You can view the detailed results in the UI by running the below cell and redirecting to the generated link. This page shows granular results for a given AI Stress Test run.
[ ]:
test_run = stress_test_job.get_test_run()
test_run
Stress testing should be used during model development to inform us about various issues with the data and model that we might want to address before the model is deployed.
AI Continuous Testing
In this walkthrough, we’ll be focusing on the production setting where we’ve deployed a model and would like to ensure that it continues to perform well as the underlying data drifts and evolves. For this we’ll need to set up and perform AI Continuous Testing. Run the following snippet to set up continuous testing to split the data into 4 week bins.
[ ]:
from datetime import timedelta

ct_instance = project.create_ct(model_id, ref_dataset_id, timedelta(weeks=4))
Next, we’ll upload some incoming production data. The data we’re uploading here is from 2019 through to 2021, which will look substantially different from what the model saw in its training data from 2018 (the data will be automatically split into pieces based on the timestamps specified and the bin size set for this AI Continuous Testing instance). We’ll use AI Continuous Testing to identify the differences and understand how they’re impacting our model.
Upload the Latest Batch of Production Data
[ ]:
dt = str(datetime.now())

if IS_SAAS:
    prod_s3_path = client.upload_file(
        Path('nyc_tlc/data/test.csv'),
        upload_path=UPLOAD_PATH
    )
    prod_preds_s3_path = client.upload_file(
        Path('nyc_tlc/data/test_preds.csv'),
        upload_path=UPLOAD_PATH
    )
else:
    prod_s3_path = f"{BLOB_STORE_URI}/{UPLOAD_PATH}/data/test.csv"
    prod_preds_s3_path = f"{BLOB_STORE_URI}/{UPLOAD_PATH}/data/test_preds.csv"

prod_dataset_id = project.register_dataset_from_file(
    f"prod_dataset_{dt}",
    prod_s3_path,
    data_params={
        "label_col": "TripDuration",
        "protected_features": ["PULocationID", "TipAmount"],
        "timestamp_col": "PickupDatetime"
    },
    agent_id=AGENT_ID
)
project.register_predictions_from_file(
    prod_dataset_id, model_id, prod_preds_s3_path, agent_id=AGENT_ID
)
[ ]:
project.update_ct_categories(["TEST_CATEGORY_TYPE_MODEL_PERFORMANCE",
                                           "TEST_CATEGORY_TYPE_SUBSET_PERFORMANCE_DEGRADATION",
                                           "TEST_CATEGORY_TYPE_ABNORMAL_INPUTS",
                                           "TEST_CATEGORY_TYPE_DRIFT",
                                           "TEST_CATEGORY_TYPE_BIAS_AND_FAIRNESS"])
[ ]:
ct_job = ct_instance.start_continuous_test(prod_dataset_id, agent_id=AGENT_ID)
ct_job.get_status(verbose=True, wait_until_finish=True)
ct_instance
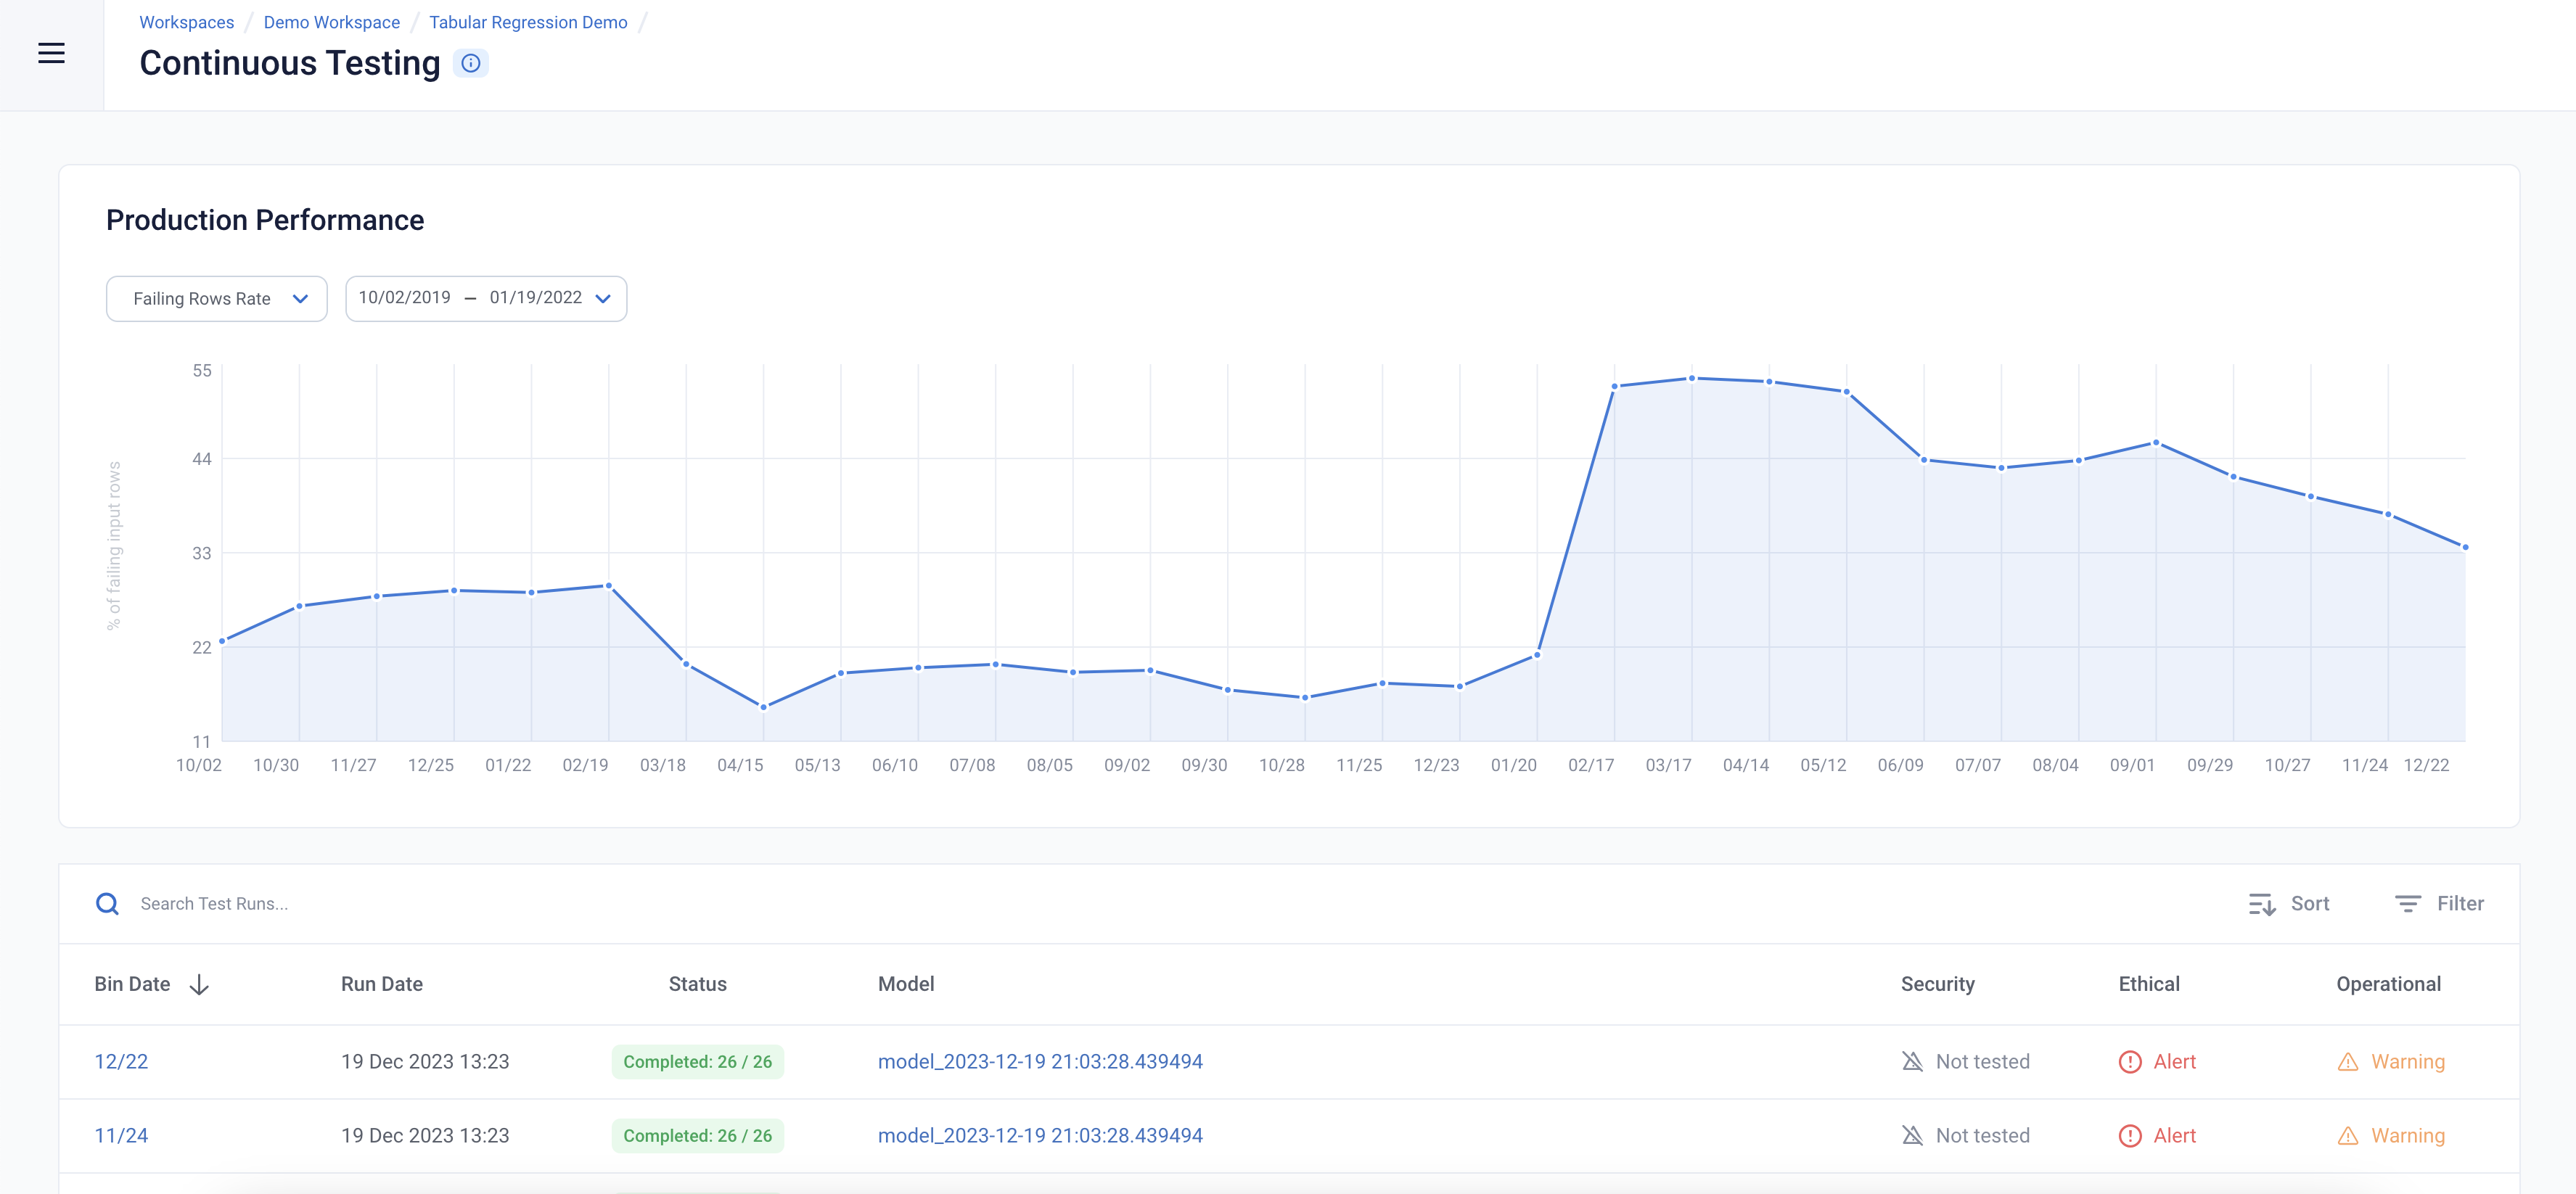
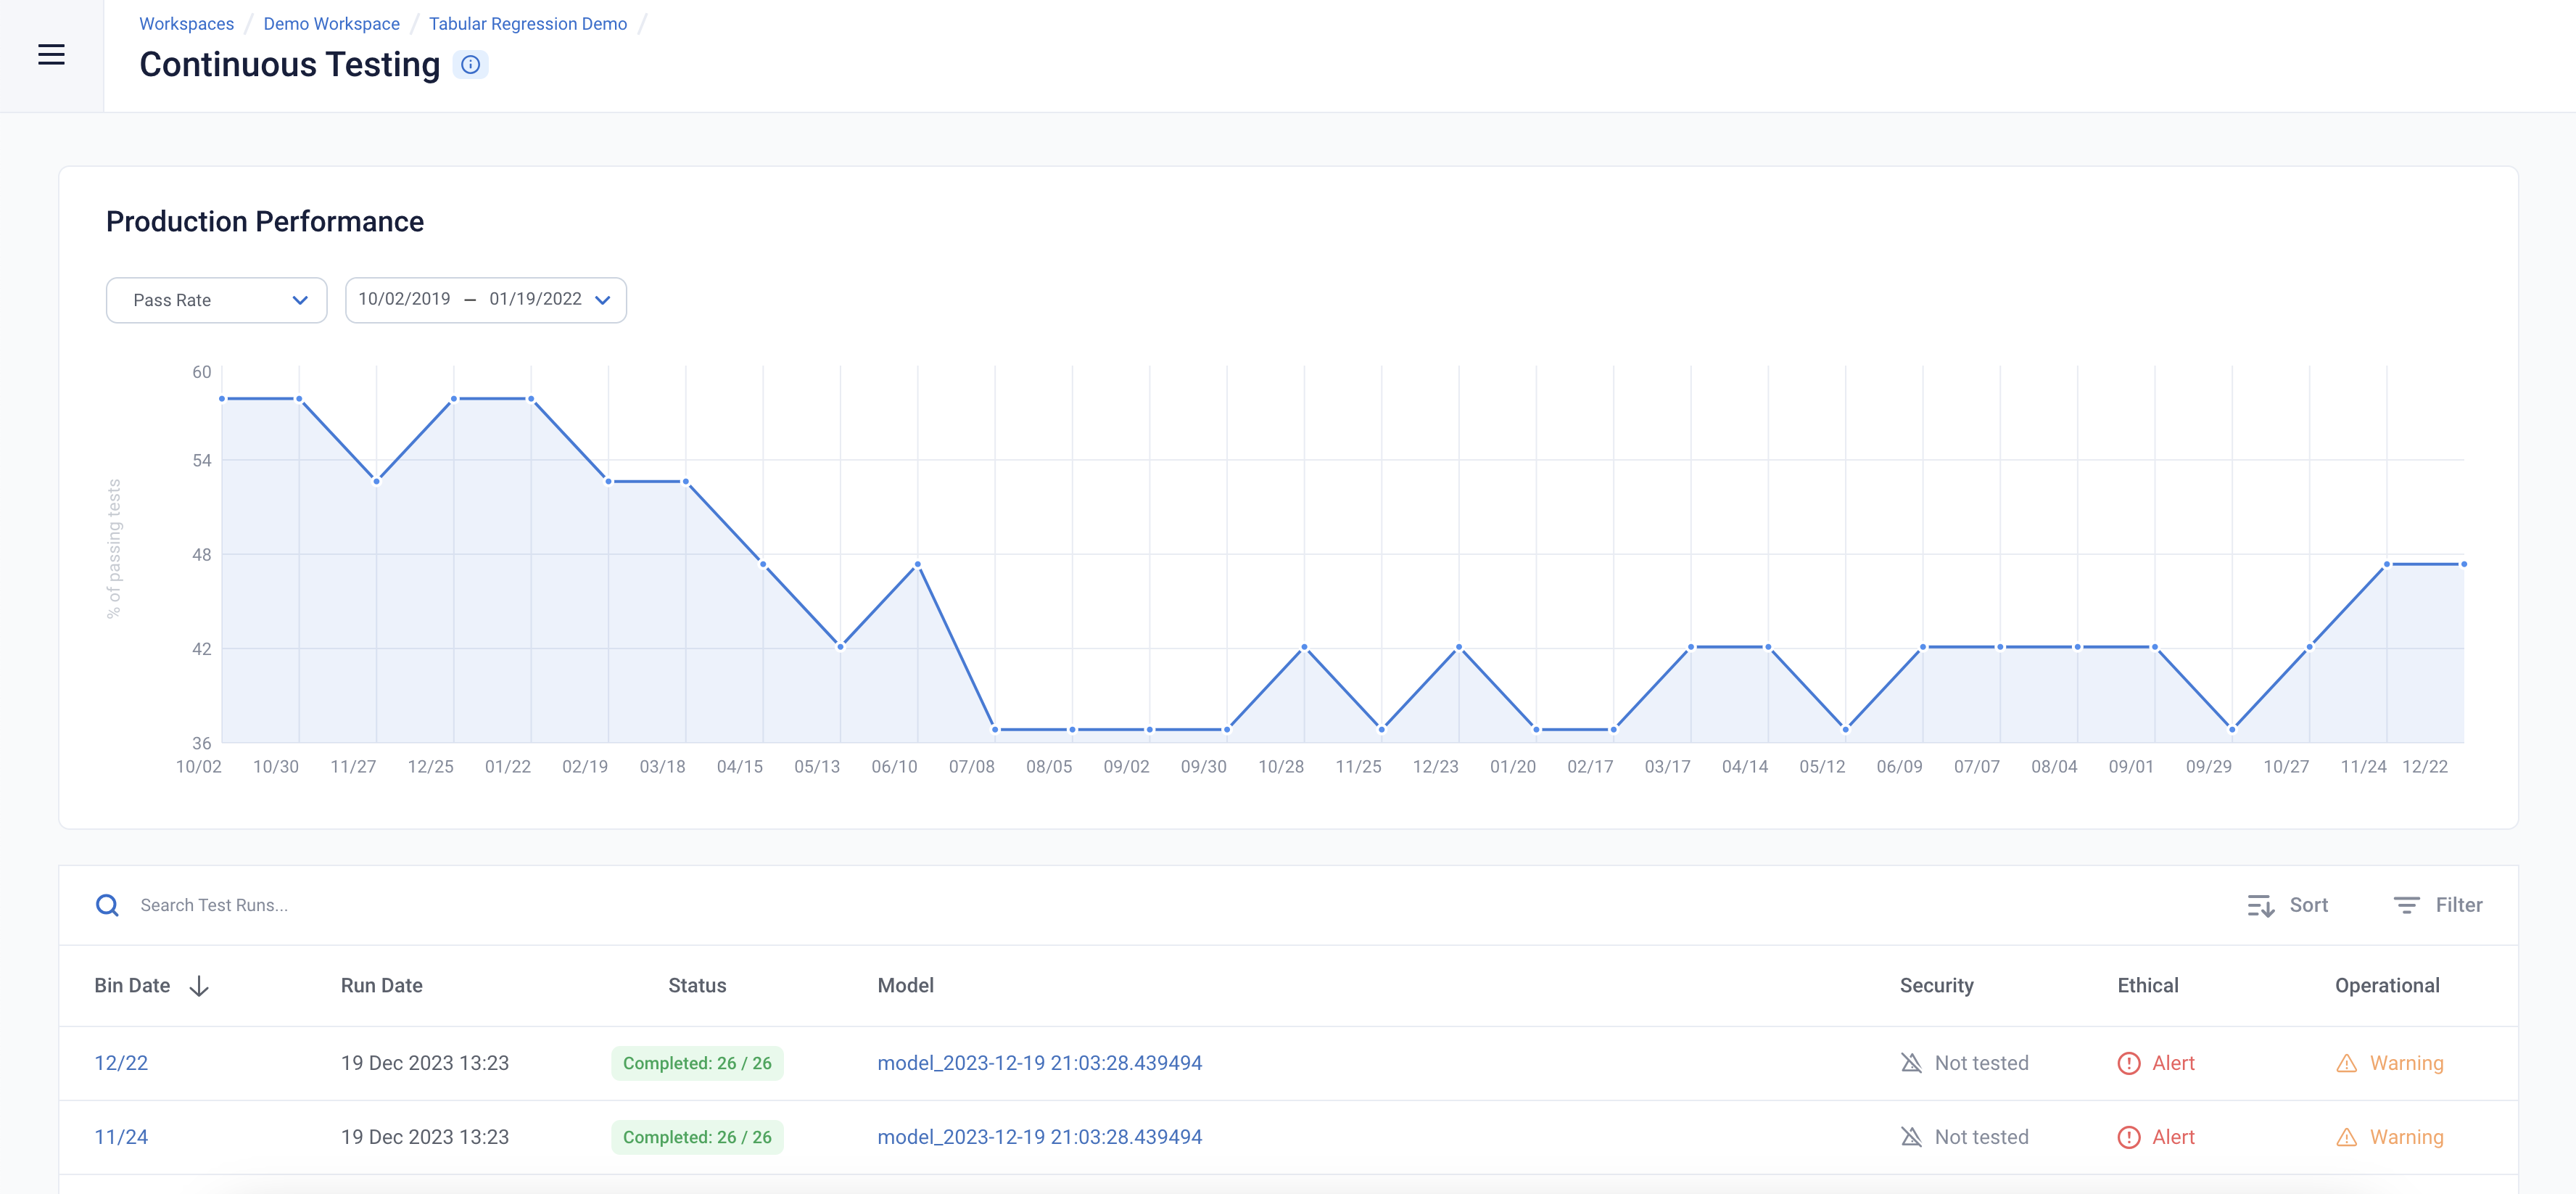
Time to see how our model is doing! Navigate to the “Continuous Tests” tab on the left nav. Here, you’ll see some of the key metrics that are being tracked over time.
We can inspect the input data for failing input values. The overall failing rows rate shows the percent of failing inputs (for all types of failing tests including outliers, missing values, unseen categories) over time. We can see that there’s a spike in the failing rows rate in early 2021 after which it remains high.